Top Stories Tamfitronics
- Bitcoin breaks above both August and September monthly highs this week.
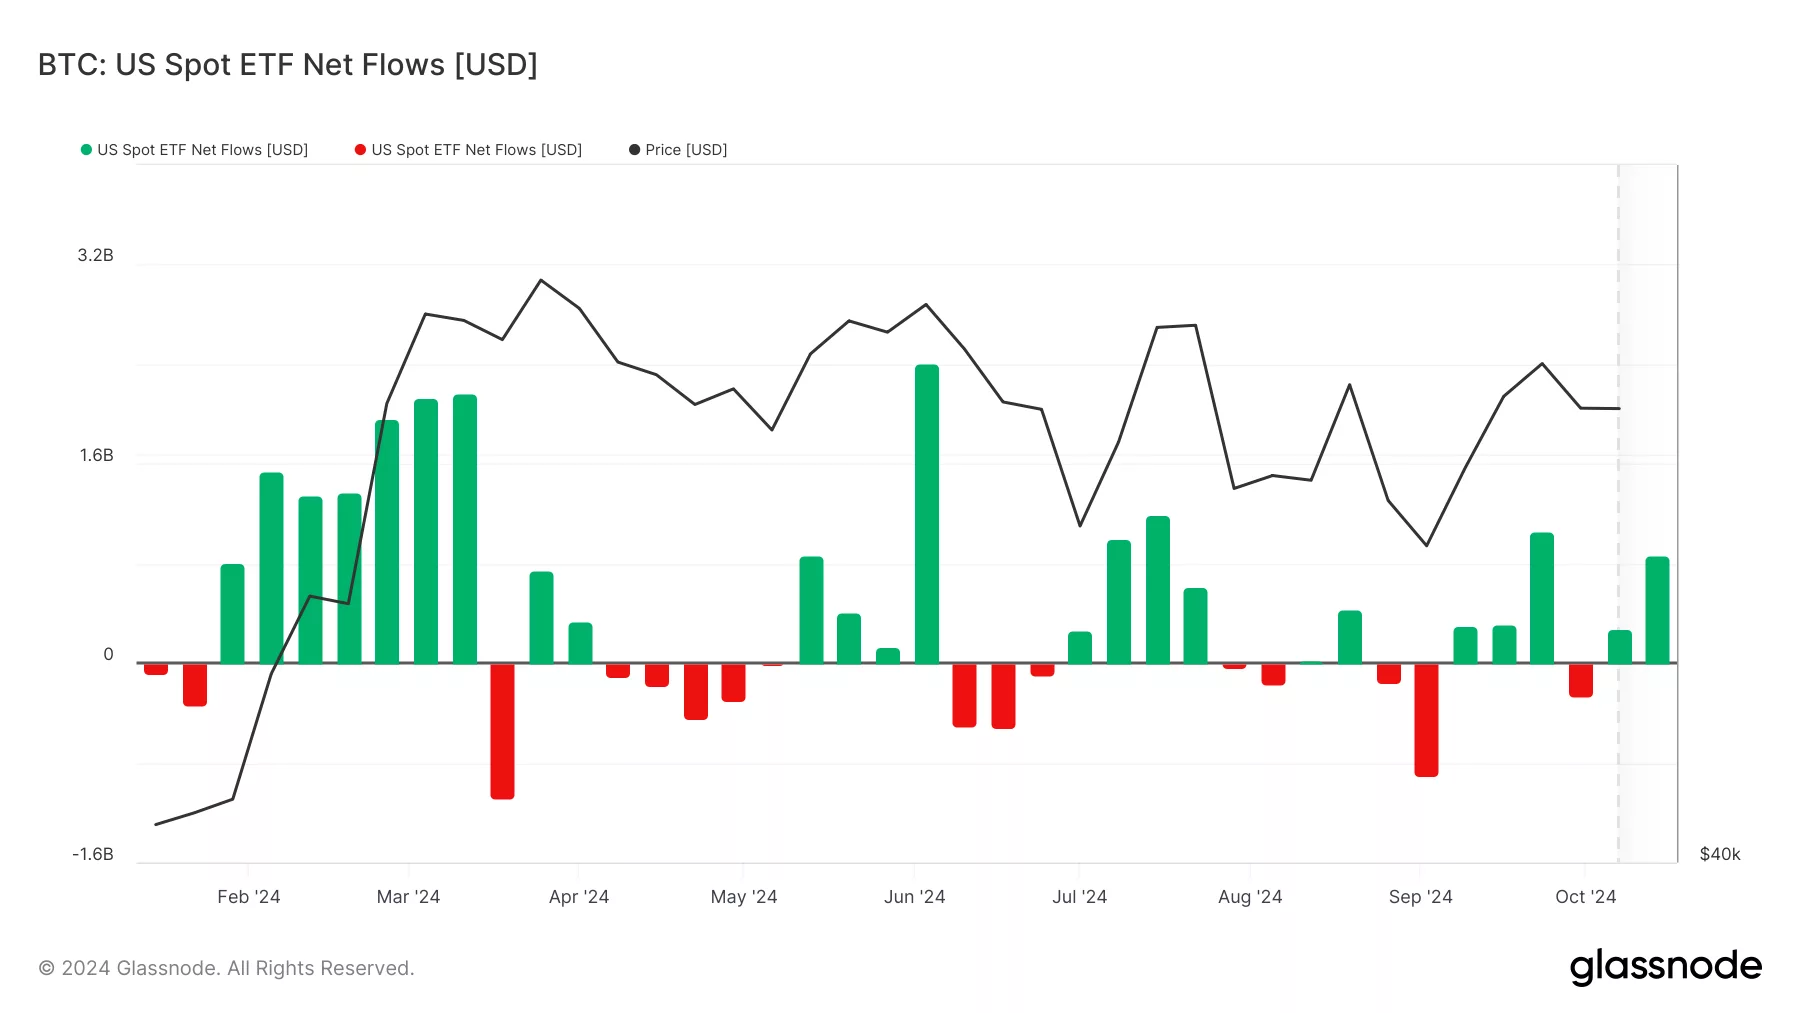
- ETF flows record their first +$500M USD net flow day since June 5th, 2024.
- Altcoin analysis: OM and BONK
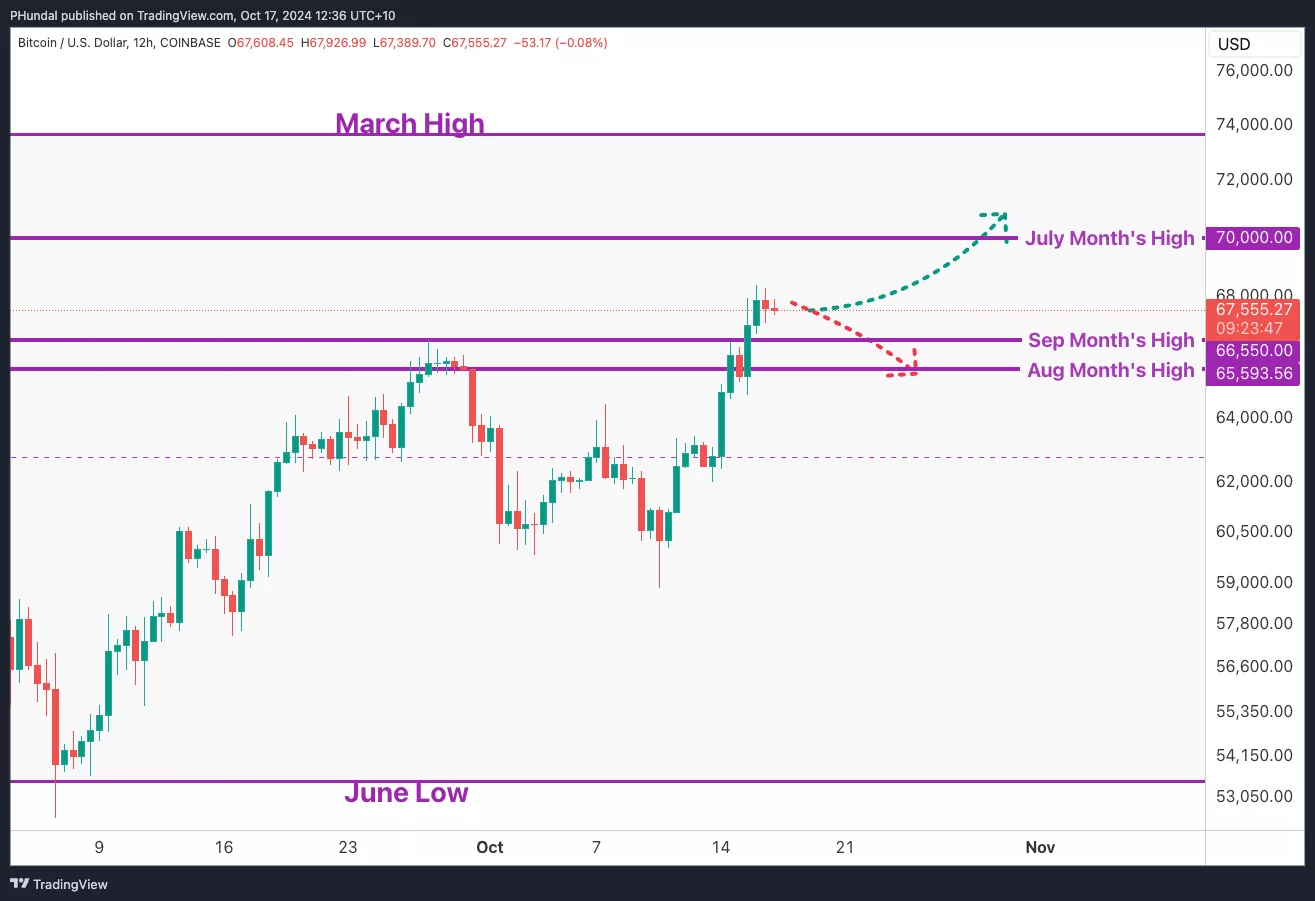
Bitcoin has surged 7.8% since the weekly open at 10 AM AEST, currently trading at $67,700 USD. This puts the price above the August high of $65,690 USD and September’s high of $66,550 USD.
Are these early signs of the bull market rally kicking off? US Spot Bitcoin ETF flows are certainly pointing in the right direction, with demand rocketing.
US Bitcoin ETF Flows
This week, buying activity dominated across US spot ETF products, suggesting a potential revival in institutional interest in Bitcoin. However, it is still too early to confirm a solid trend.

On October 14th, net inflows reached $555 million USD, significantly higher than the current daily average of $103 million USD.
Related: Radiant Capital Suffers Second Exploit in 2024, Takes $50 Million Hit
Macroeconomic data ahead
Tonight, US retail sales data is expected at 10:30 PM AEST, with a forecast of 0.1% growth.
Tomorrow, China’s GDP update is set for Noon AEST. The growth expectation is 4.6%, slightly lower than the previous month’s result.
Fear and greed currently reads 60 – Greed.
Bitcoin – BTC
Prices are currently trading above the September and August highs as we head into the weekend. We are just over the hump of October, with another two weeks ahead in the month. Below are two possible scenarios on where price may lead next.

Bullish Scenario
If demand continues to stay strong, Bitcoin could approach $70,000 USD, a level last seen in July.
Bearish Scenario
If the rally loses momentum, prices may retreat to test the highs from September and August. Monitoring the market’s reaction around this range will be key.
Related: Miles Deutscher Reveals His Top Altcoin Pics for This Bull Run
Mantra DAO – OM
An asset in the Real World Asset (RWA) category, OM has caught my attention as it has been showing regular strength compared to the other top 100 assets and is currently in price discovery. When we apply a Fibonacci retracement extension, we get the analysis below.
Bullish Scenario
I expect if the current Fib structure continues to hold up $1.6319 and $1.9047 could be expected should demand hold up.
Bearish Scenario
The next level lower would be the previous range highs of $1.4174, failure of that level could result in a deeper pullback.
Bonk Inside – BONK
One of Solanas favourite top 100 meme-coins looks very interesting to me on the weekly timeframe.
Bullish Scenario
Momentum from this point could continue to push BONK higher, towards the ‘golden’ Fibonacci region highlighted in green around the 0.618 ratio. Once we move to that region we would look to see what the next move is from the market.
Bearish Scenario
Failure to find any demand at these current levels could see BONK test previous lows from the start of October.
Keep up to date.
Stay informed and connected! Subscribe to Crypto with Pav on YouTube, where I dive into the latest trends in cryptocurrency, offering insights on what’s coming next and highlighting news and technical structure I believe is crucial.
You can also follow me on X.
Cheers!


